Dr. SOEURN Visal
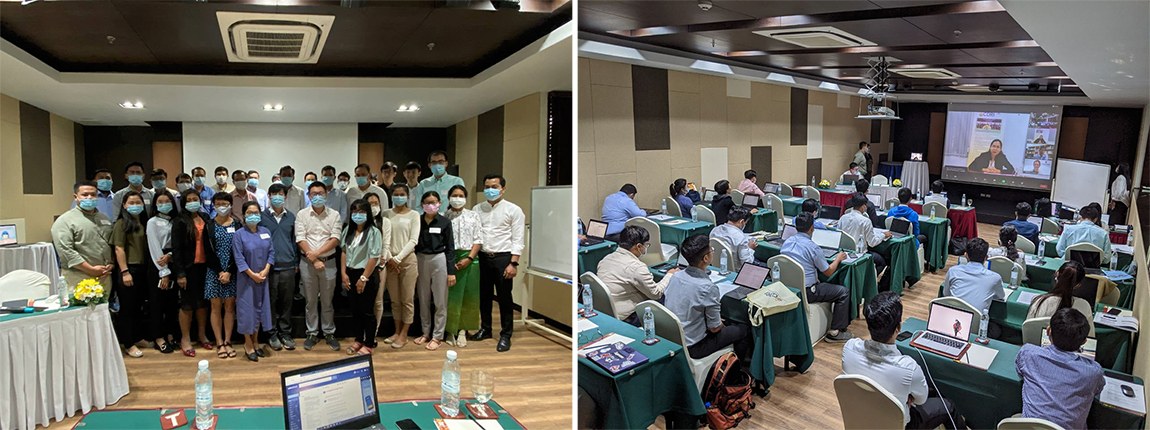
In Siemreap province, from 2 to 4 February, over 30 participants from universities, TVET institutes, research think tanks, and government ministries were engaged in a mixture of lectures and hands-on practical exercises on handling, transforming and visualizing data with R. R is a world-known free software environment for statistical computing and graphics especially when it comes to manipulating large dataset such as census or to handling multiple survey datasets at once.
This was a three-day intensive workshop instructed by Dr. CHEA Vatana and Dr. CHEA Phal, experts in quantitative data analysis, who are the senior researchers at CDRI and have authored and co-authored more than a dozen scientific papers. The training workshop was designed for junior scientists, faculty members, researchers and graduate students (master and PhD) who wish to strengthen their computer application skills or to gain more knowledge in utilizing R. The topics covered in the course were:
- An introduction to R and Rstudio, understanding data structure, type and class, and basic R functions
- Indexing and subsetting
- Static data visualization using ggplot2 package
- Manipulating and transforming data using tidyverse package
- Applying statistical and econometric techniques to analyze survey data in R
Ms. Eng Muyngim, the researcher from UP, who took part in this workshop, said that this was a great opportunity for her to brush up her R skill, which she first learned about it during her studies at University of Paul Sabatier, Toulouse III since 2015. The course was useful and inspired her to share with her colleagues and students to experience the new technology to compute a large variety of classical statistic tests (Student’s t-test, Wilcoxon test, Analysis of variance (ANOVA), Chi-square test, Correlation analysis) as well as to draw beautiful and visible box plot, histogram, density curve, scatter plot, line plot, bar plot by using R.